Semi-Annual Financial Results Briefing
for Fiscal Year Ending March 2011
Oct. 29, 2010

Thank you very much for joining our Operational Briefing despite your busy schedules. I’m Satoru Iwata, president of Nintendo.
Usually, I would first provide the general outline of our mid-term financial results that we announced on the previous day. For this year, however, I’d like to omit the explanations of these numbers as the results we announced yesterday were almost in line with the revised forecasts that we had announced after Nintendo Conference 2010 only a month ago. However, when we read the articles resulting from our announcement yesterday, some reported as if the company had to account for "Operating Loss" due to bad sales. Let me reconfirm here that we have reported 54 billion 2 million yen of "Operating Income" so the profit from our sales is in the black. What we reported was "Ordinary Loss" and it was solely due to the reevaluation of the assets we have in non-Japanese yen currencies. Even when the amount of the non-Japanese assets we have do not change a lot in their original currencies, at the end of each fiscal quarter, Nintendo, as a Japanese listed company, has to reevaluate the values of these assets in the Japanese yen. The huge reevaluation loss of the assets was the sole reason for the Ordinary and Net Losses.

Now, I’d like to explain to you about the market situations around the world, first in the U.S., then in Europe and in Japan.
Many of you must have the impression that Nintendo’s business, which surged with the sales of Nintendo DS and Wii, has already peaked. Under such circumstances, it would be difficult to grasp the larger picture of the entire video game market if I talked only about the year-on-year comparisons and the market share. Accordingly, I’d like to also introduce you to an alternative viewpoint today.

First, about the United States.
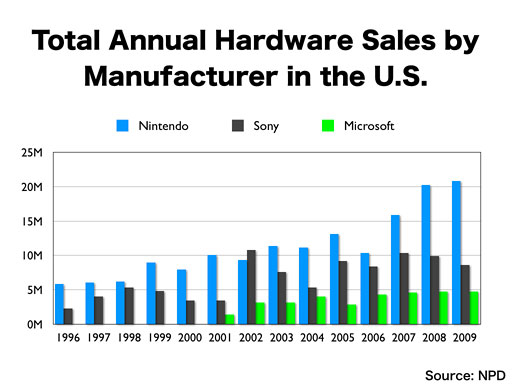
Based on NPD data, we have compiled this graph, which shows how many hardware units were sold by each platform holder in each calendar year, starting from 1996, when Nintendo launched Nintendo 64. We can understand that in the three consecutive years of 2007, 2008 and 2009, the hardware sales of Nintendo platforms reached record levels.
Until about the same time a year ago from today, our sales in 2009 were showing significant year-on-year decline. Fortunately, our sales were up in the year-end, and resulted in the right-end bar of this graph.
The 2010 calendar-year results will be determined by the year-end sales, but we do not expect Nintendo’s hardware sales, or the combined unit sales of Wii and Nintendo DS, to go below 15 million.
Depending on whether you choose to compare Nintendo’s calendar year performance before the 2010 year-end sales season with our own previous records or whether you choose to focus upon Nintendo’s performance and its presence in the industry as a whole, your evaluation of Nintendo must be completely different.
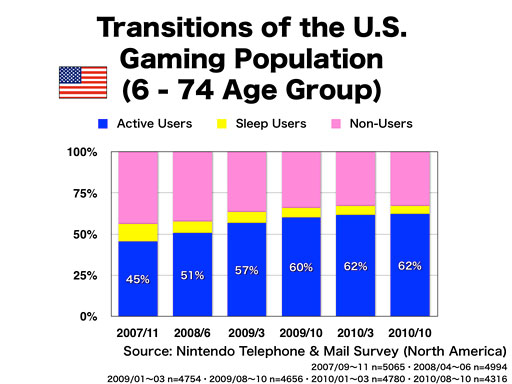
As I informed you in the past, Nintendo has been periodically surveying the transitions of the gaming population. What you are looking at now is the situation in the U.S.
The Active Users, described in blue in this graph, are the people who have played with a home console video game machine or a handheld video game device, from Nintendo or another hardware manufacturer, at least once in the recent year. The Sleep Users in yellow are those who used to play but have not played in the last year. The pink Non-Users are those who have never played video games.
I have just received the most recent survey data. Even though the very high Active User ratio of 62% has remained stable even during the most recent summer, you may wonder if our gaming population expansion goal has been at a standstill. By using different colors, let’s identify the ratios of the users of Wii or Nintendo DS or both.
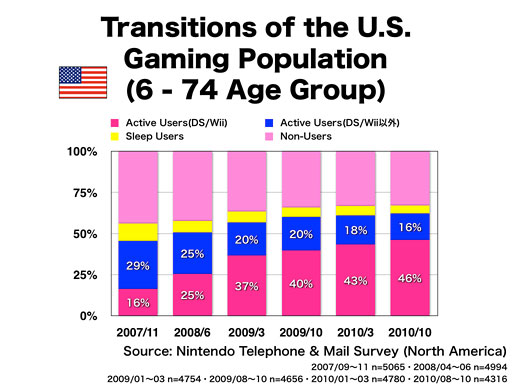
It looks like this.
Contrary to the impression you might get from the decreased sales of Wii and Nintendo DS, the number of consumers who are playing with these game systems is actually increasing in the U.S.

Based upon our surveys, these are the transitions of the number of Wii and Nintendo DS users. In the U.S., Wii users are steadily increasing, and in the most recent survey, the total number of Wii users finally topped 100 million.
I’d like to show you the sales transitions of home console video games now.

This chart shows the weekly unit sales of Wii, PS3 and Xbox 360 in the U.S., based on monthly data issued by NPD for January to September of 2009 and 2010. The deep-colored lines indicate this year and the pale lines represent last year. As I have mentioned in the past, this data, from the independent NPD Group, is published only monthly, and the monthly data fluctuates from a four-week month to a five-week month, so in this graph, we are showing the weekly averages.
When we make a year-on-year nine-month comparison, what is notable is that, since the new hardware model of Xbox 360 was launched in June this year, it led the U.S. market for four consecutive months. As for Wii, while this year showed a similar sales pattern to last year during the March - August period, a large sales gap was found in September as Wii experienced a hardware price markdown in September 2009.
At the end of last year, Wii showed explosive sales, but the sales trend about a year ago from today did not show any signs of the explosive sales to come at the critical year-end sales season. Last year, the timing of when U.S. citizens started their significant holiday gifts purchases was later than in previous years. This year, it is said that this timing will come even later than last year, and even from the most recent sales data, the significant sales increase in the unit sales of the home consoles is yet to be seen.
How we would maximize the sales opportunities during Thanksgiving and Christmas was already a key point to us in 2009, and this year, we anticipate that it will become even more important.
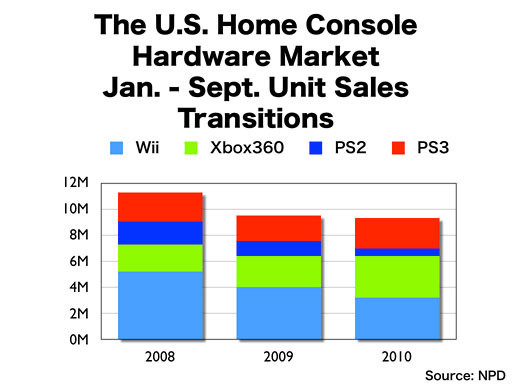
This graph, based on NPD data, shows the sales transitions of home console hardware in the U.S. from January to September in 2008, 2009 and 2010. In this graph too, the change in Xbox 360 sales can be observed. When we focus upon the hardware unit sales so far this year, Wii and Xbox 360 are almost equal.
Just as we did last year, we are aiming to regain the momentum for Wii at the year-end sales season.
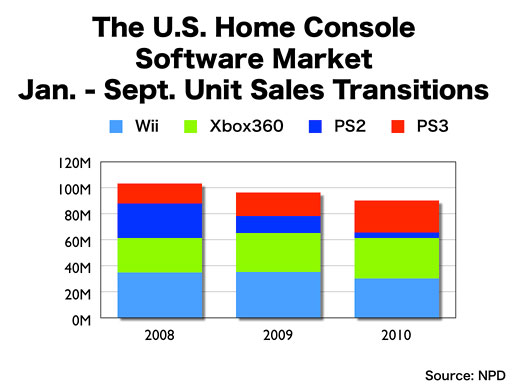
The U.S. home console software transitions look like this.
Due partially to the fact that the U.S. video game market rapidly expanded until 2008, the software sales in the first nine months of both of the following years showed declines.